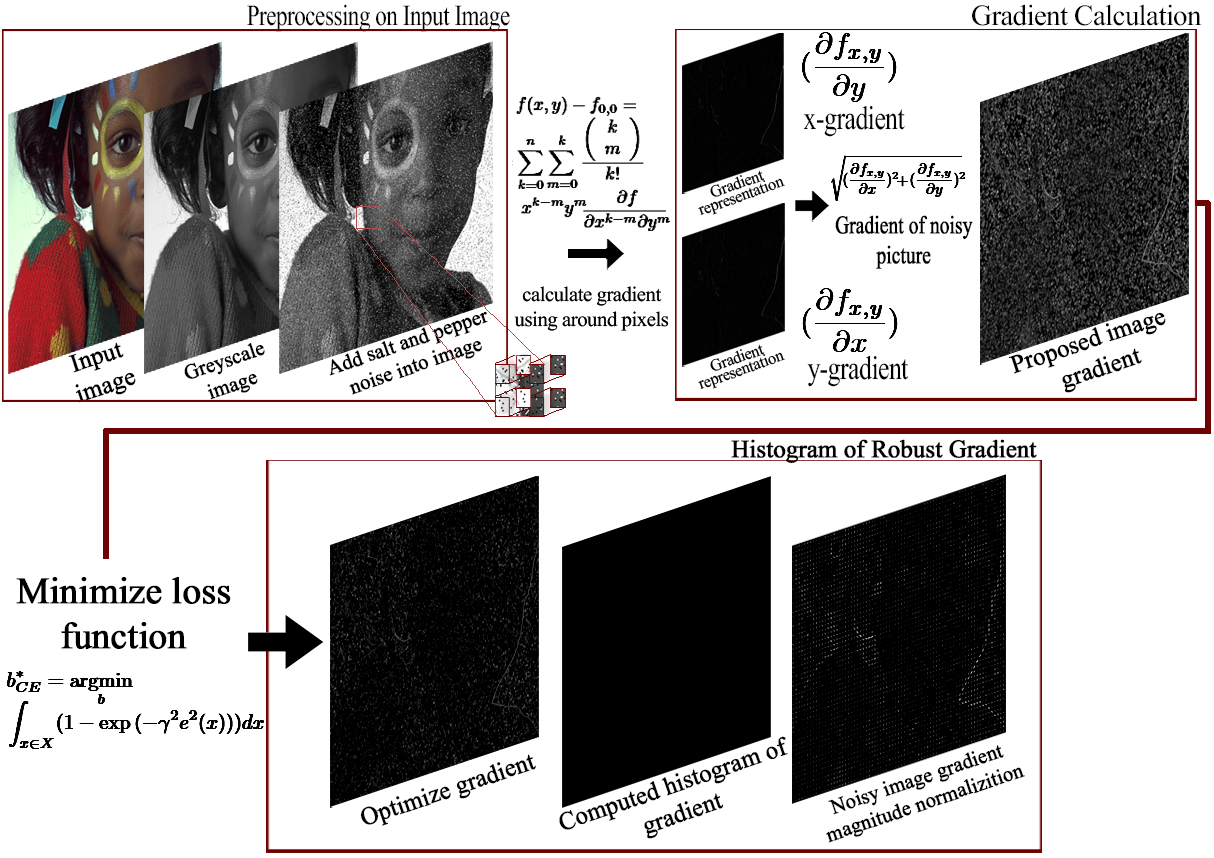
In our paper, a new robust method was introduced to compute the HOG features and it is particularly studied on the noisy images to present the reduced impact of noise. The proposed method contains three phases leading to a higher performance against noisy images, and it is replaced in the image gradient calculation process. In the first step, the approximation phase is simply done by using the Maclaurin series, and it produces an acceptable outcome, promising result and execution time. In the following, we investigate the accuracy and correctness of the previous phase by minimizing the loss function-based optimization problem in tuning phases, in which least square and correntropy loss functions are used. In the last phase, we use the correntropy loss function in our method which is finally found robust against outlier noises. In this case, Gaussian and Salt and pepper noises are debated. Eventually, we compare the final result with the image histogram of gradient made by the Sobel method.
Finally, I should say all optimizing functions done by myself.
First phase
We conclude we can write for 2-D signals as below(each row is Maclaurin series for a specific point):
By completing this stage, there are wonderful results when we choose n=64. In addition, I should say the points I selected have an important role in focusing accurate first two terms calculation. Therefore, The main challenging point in the first step was choosing points fed into the system.

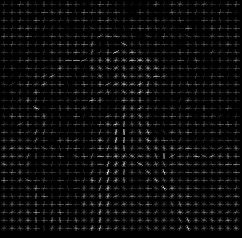
the left picture is the outcome of sobel method while the image is damaged by salt and pepper 5%. The right side is the output of our first method.
Tuning phase
So, this is our function to minimize:

The purpose of the optimization problem defined is to find the optimal value of b so that the disparity between the value of the function f(x) and its Maclaurin series is minimized. By taking the first two derivatives of main equation, with respect to b and setting it to 0, we get:

Then, we use LS to minimize the error mentioned. It makes a better outcome, but in the presence of noises, it will not work well. So, we choose the correntropy loss function to have a robust histogram against noises.
This paper used LS(least Square) and Correntropy loss function for optimizing the overall result in regular images and cleaning outlier noises effect, respectively.


After optimization, we normalize the image to reach a better illustration.

The repetition of the while loop, in table III, produces some Round-off errors provided by pseudo matrix computational. In this part, the error act as noise. So, it should be avoided to learn two phrases raised more than certain iterations in the while loop because it prevents us to reach the best and real HOG result.
I should mention that the points used in the method II and III are different from the points used in approximation phase. It is because I focus on gaining the first two derivatives in the first method while I ignore the remained terms by placing particular points into the system, But the main concentration is noise reduction in the method II and III.
noisy image stained 3% salt and pepper, approximation method, least-square and correntropy loss function, respectively.